Analyzing How Much Time I Spend in Meetings (using SQL and Python)

tl;dr: I will show you how I ran some simple analytics on my Google Calendar history over almost 7 years. I used SingleStoreDB for this, but it should be straightforward to do this with any database. Skip to the second part if you don’t care about the technical process that allowed me to analyze this data.
Table of Contents
The Technical How-To For Getting The Data
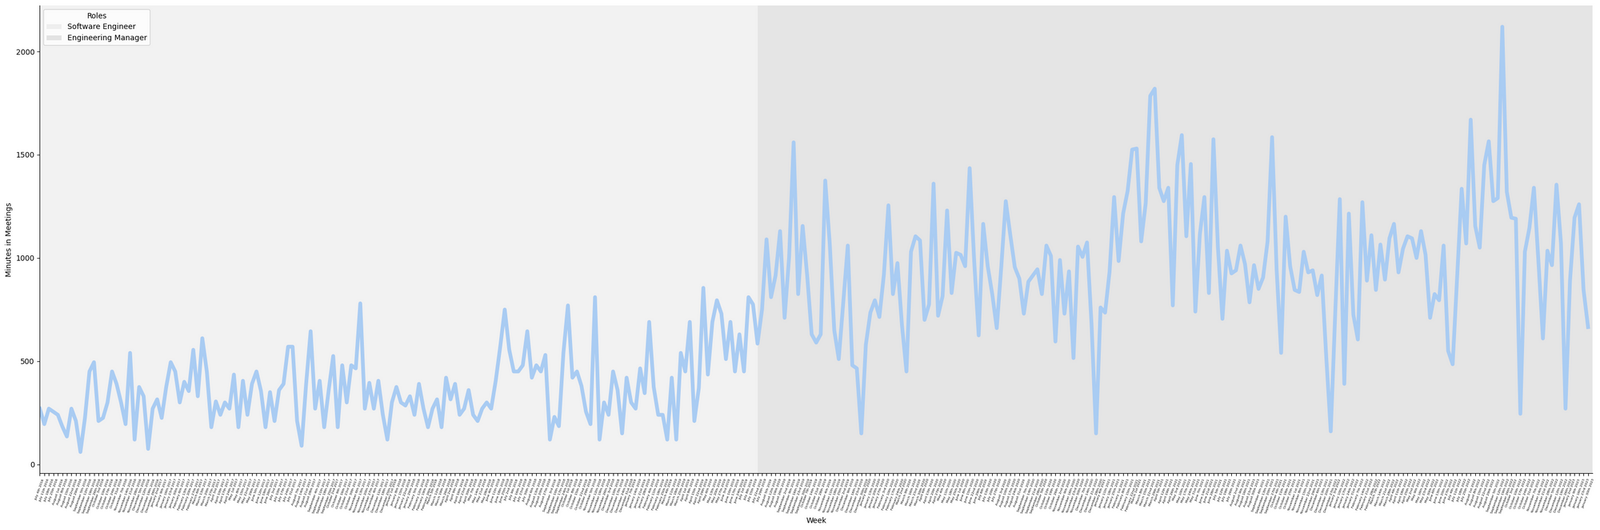
I’ve figured out a simple enough method that allows me to analyze my Google Calendar data. For instance, I was able to come up with this graph which roughly tracks my time spent in meetings over almost 7 years of working at SingleStore:
Let’s dive into how others can do this as well.
Getting a ICS File From Google Calendar
The first step is to open the Google Calendar settings and go into the “Import & Export” section. Once there, you can download a ZIP archive of .ics files (one for each of your calendars). You probably only need one of the .ics files which is the primary Events calendar.
Converting the ICS File to a CSV File
We have to take this .ics file and generate a .csv from it. We will be using Python for this, so I assume you have Python 3 and pip installed.
Start with installing some required dependencies:
# We need a few dependencies first.
$ pip3 install bs4 recurring_ical_events icalendar
Then, you can clone davidgomes/ical2csv to download the ical2csv.py file.
Notice that davidgomes/ical2csv is a fork of martinm76/ical2csv which is a fork of erikcox/ical2csv. (I have an open PR against martinm76/ical2csv that I am hoping to merge).
Once you have the ical2csv.py file, here’s how you can use it:
$ python ical2csv.py mycalendar.ics
This will generate a matching mycalendar.csv file!
Analyzing the CSV File
Obviously, I decided to use SingleStoreDB to analyze this data. However, since the data size (8000 rows for me) is really small, any database should do the job. I’ve never tried DuckDB, but it should be a great fit for this.
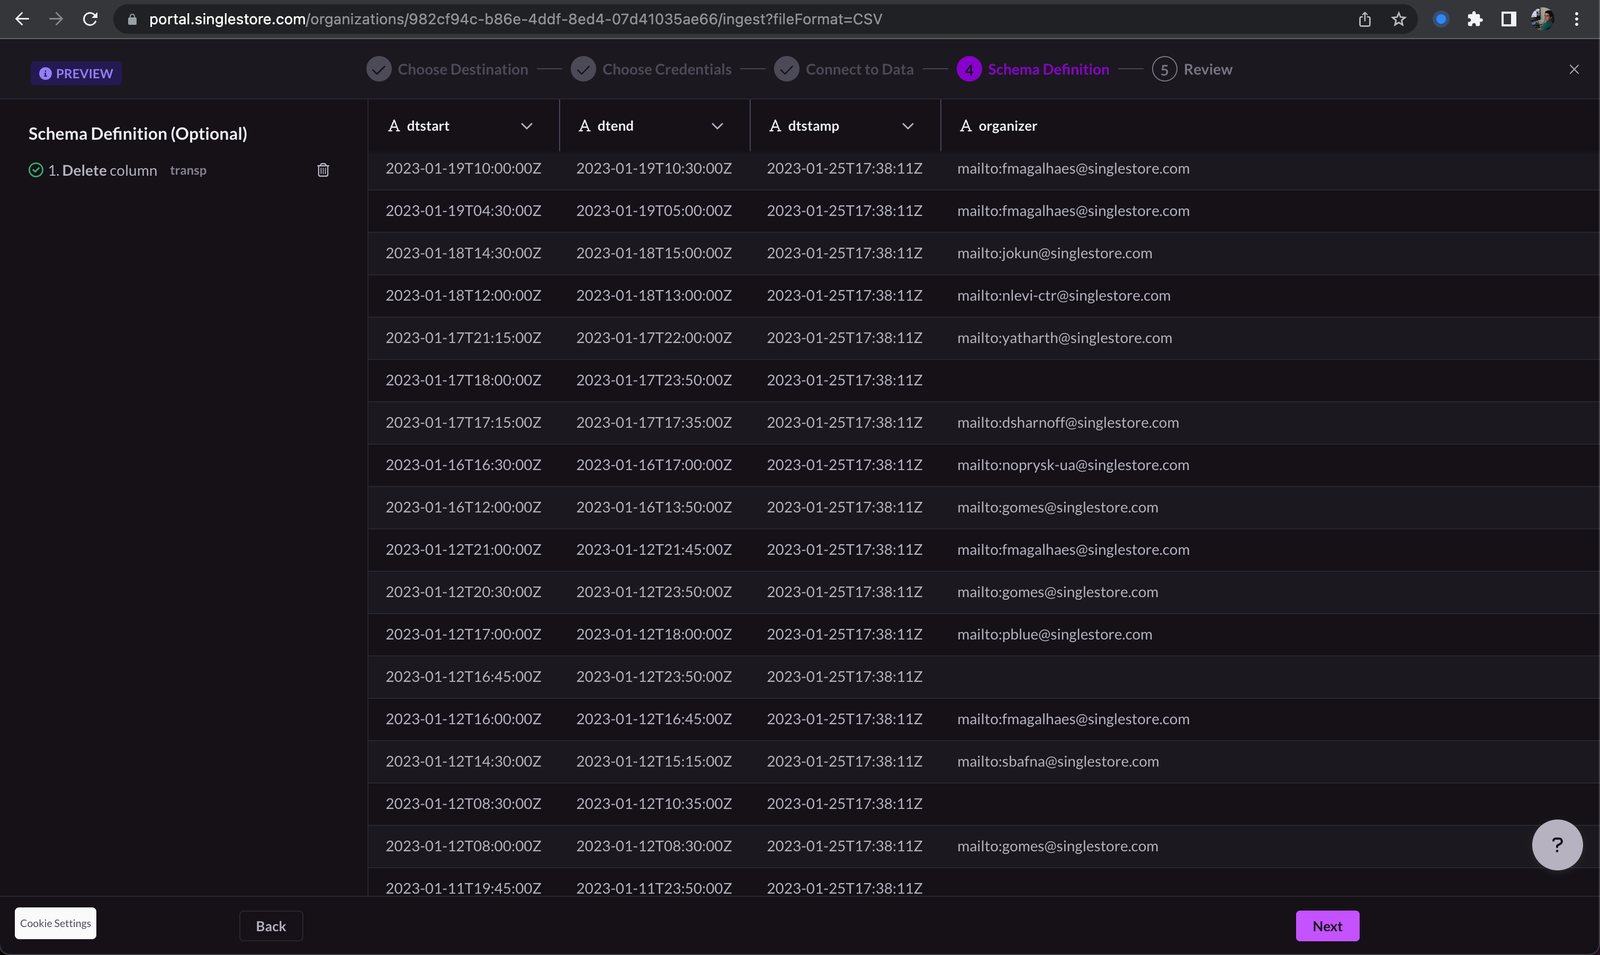
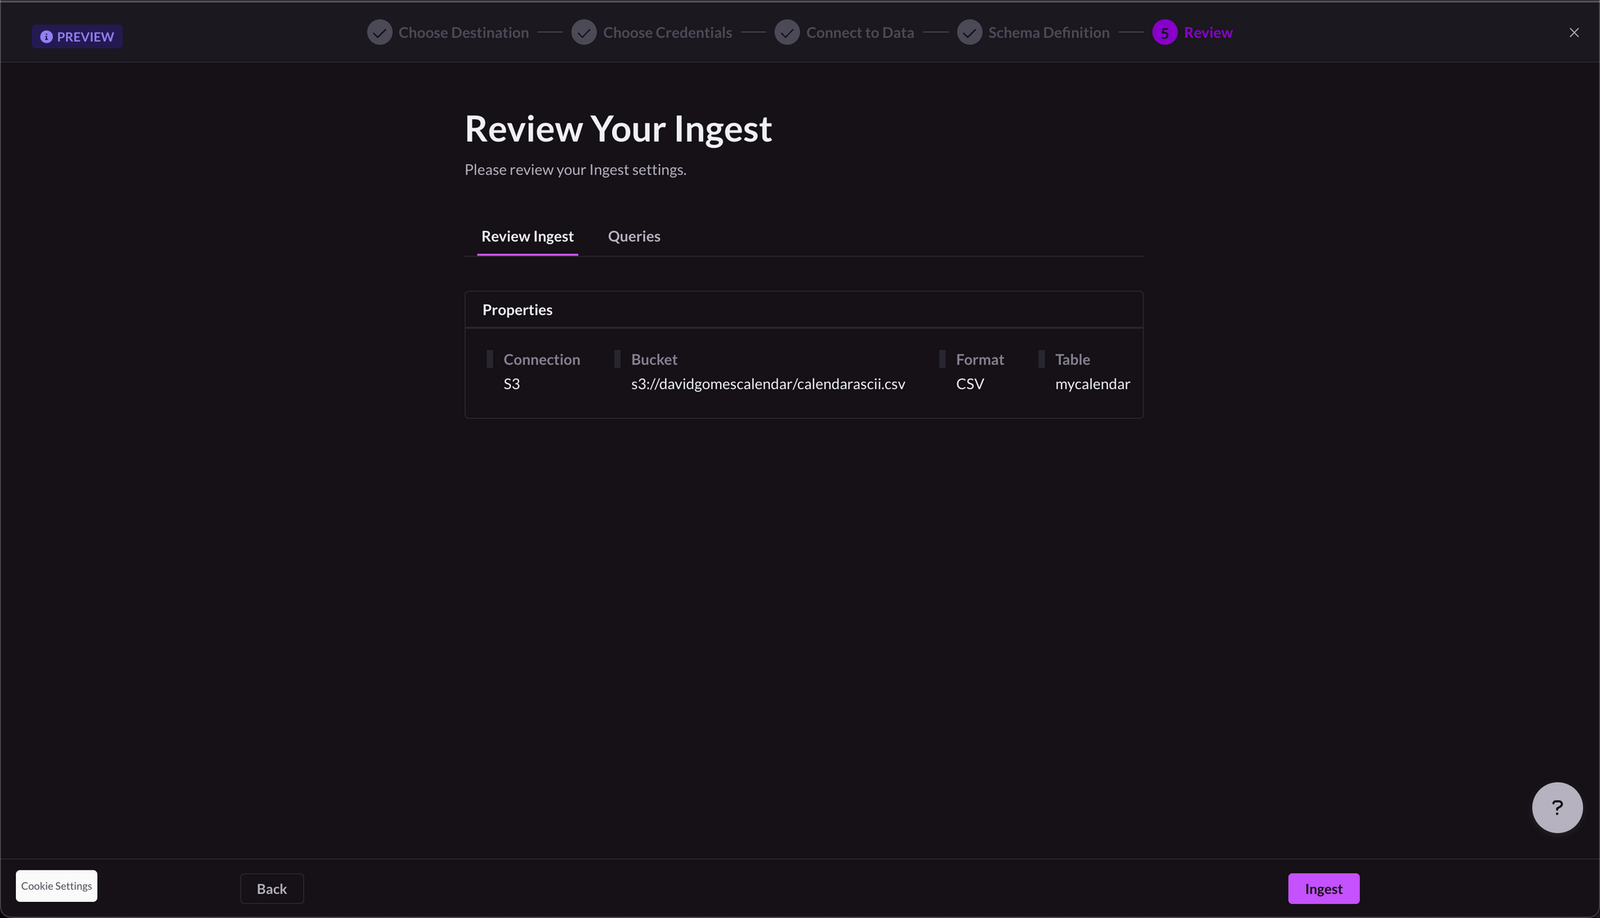
So, the first thing I had to do was load the CSV file into SingleStoreDB. I used the Ingest UI feature which automatically infers the CSV schema for me:
Once the data was loaded, I started playing around with it and eventually came up with the following “algorithm”:
- Ignore any “all day” calendar events.
- Ignore all the events that are longer than 90 minutes (this excludes a lot of fake events such as focus time blocks, lunch blocks and other miscellaneous things). YMMV.
- Ignore any events that have
DNSorOOOorFlighton their title. - Filter the time range only from when I started working at SingleStore up until now.
- Group the data in weeks and add up the duration of all the events in the same week.
The SQL for this is the following:
select
  sum(duration) as "Minutes in Meetings",
  DATE_FORMAT(
    DATE_SUB(
      starttime,
      INTERVAL WEEKDAY(starttime) DAY
    ),
    '%M %D %Y'
  ) as "Week" -- get monday of week
from
  (
    select
      if(
        dtstart LIKE '____-__-__T__:__:__Z',
        to_date(
          dtstart, 'YYYY-MM-DDTHH24:MI:SSZ'
        ),
        to_date(
          dtstart, 'YYYY-MM-DD HH24:MI:SS'
        )
      ) as starttime,
      if(
        dtend LIKE '____-__-__T__:__:__Z',
        to_date(dtend, 'YYYY-MM-DDTHH24:MI:SSZ'),
        to_date(dtend, 'YYYY-MM-DD HH24:MI:SS')
      ) as endtime,
      timestampdiff(minute, starttime, endtime) as duration
    from
      mycalendar
    where
      dtstart not like '____-__-__'
      and dtend not like '____-__-__' -- ignore all day calendar events
      and starttime >= '2016-07-01' -- remove weird 2012 calendar events
      and endtime < '2023-02-01' -- go only up until the end of january 2023
      and summary not like '%DNS%' -- ignore DNS and OOO blocks
      and summary not like '%OOO%'
      and summary not like '%Flight%' -- ignore flights
      and duration <= 90 -- remove events longer than 90 minutes
    group by
      starttime,
      endtime,
      summary -- clean some duplicates??
    order by
      starttime
  )
group by
  year(starttime),
  weekofyear(starttime)
order by
  starttime;
(One known limitation about the approach here is that this query will not return rows for weeks without any calendar events.)
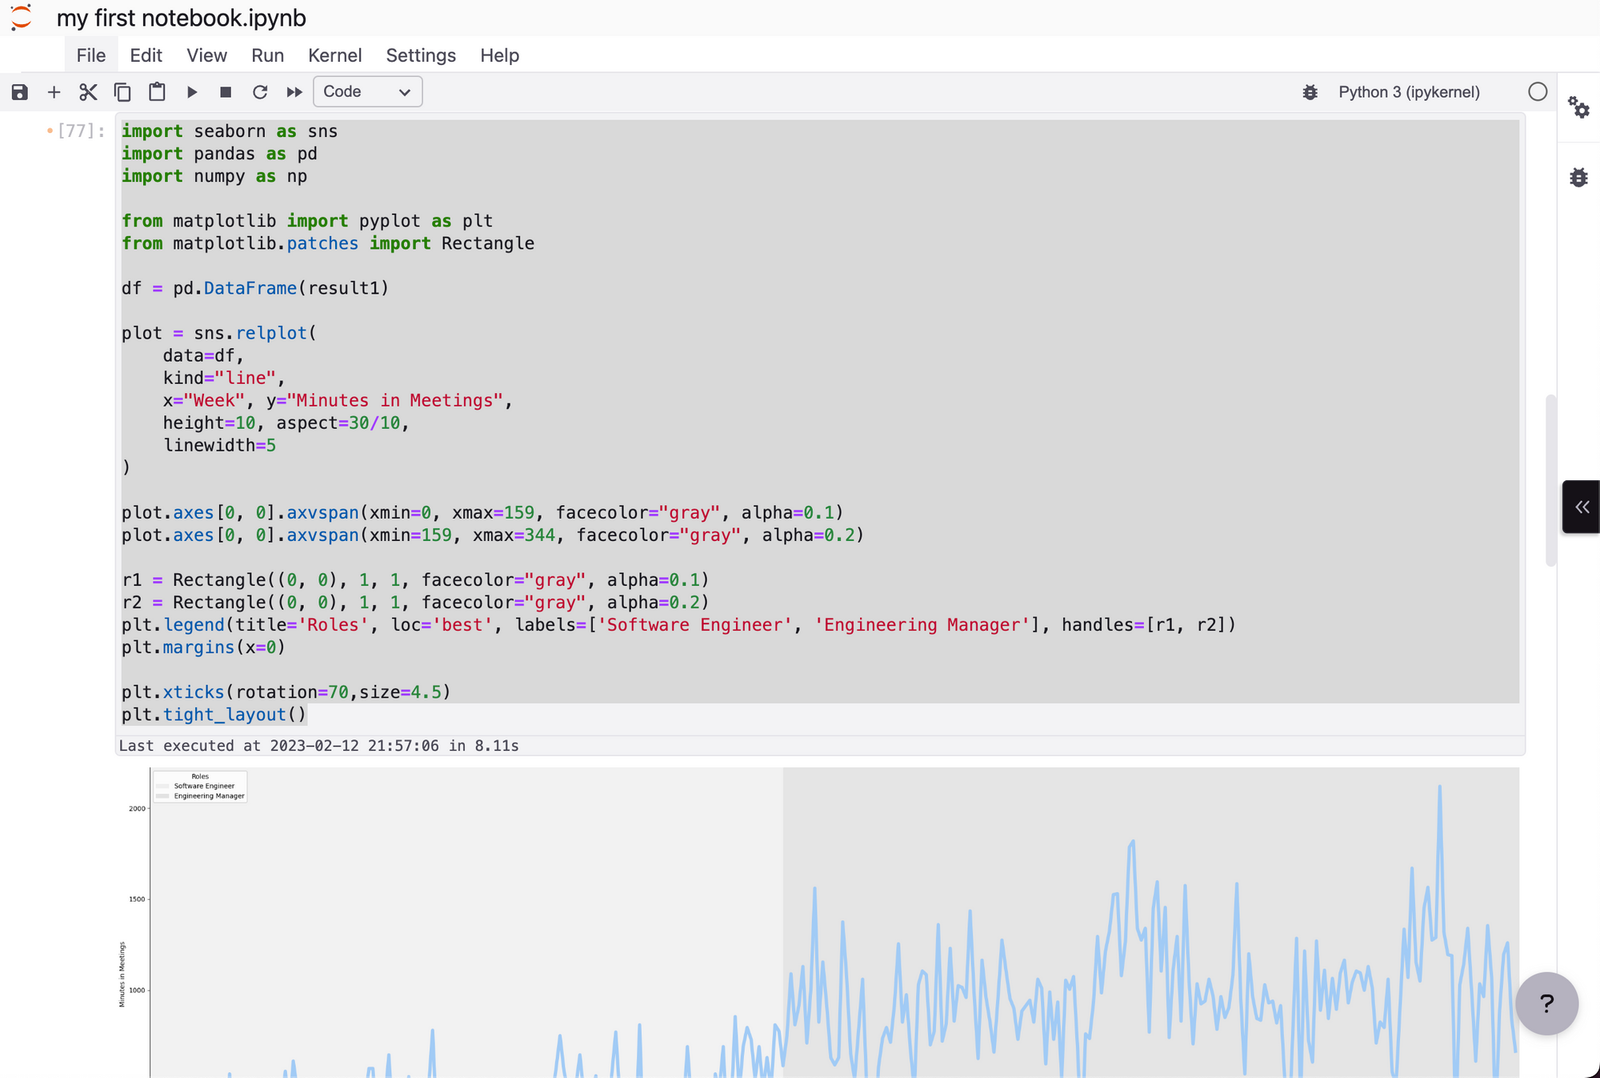
Next up, I decided to visualize this data. I loaded up a Jupyter Notebook, connected it to my SingleStoreDB instance and then used Seaborn to plot it.
What Else Can We Do With The Data? Could We Automate This?
I’ve had some ideas of things that would be interesting to look at, but I’d love to hear other ideas as well.
- Plot out how much time you’re spending in 1:1 meetings versus larger meetings.
- Compute the list of people with whom you’ve spent the most time in meetings.
- Compare time spent in recurring meetings versus one-off meetings.
In addition, it would be very interesting to automate this entire process and even set up weekly reports on this data. It may be possible to do that using Zapier/IFTTT/trigger.dev.
Of course, comparing this data across one’s tenure at different companies is going to be tricky.
(Notice that Google Calendar recently added a new built-in feature called “Insights” which is good enough for simple analysis)
How Much Time I Spend in Meetings Over Time
My ultimate goal with all the work described so far was to analyze how much time I’ve spent in meetings as my role has evolved:
It was obvious that how much time I’ve spent in meetings increased when I transitioned into an Engineering Manager position. (But in a weird way, looking at the data dead on is still a bit of a shock for me.)
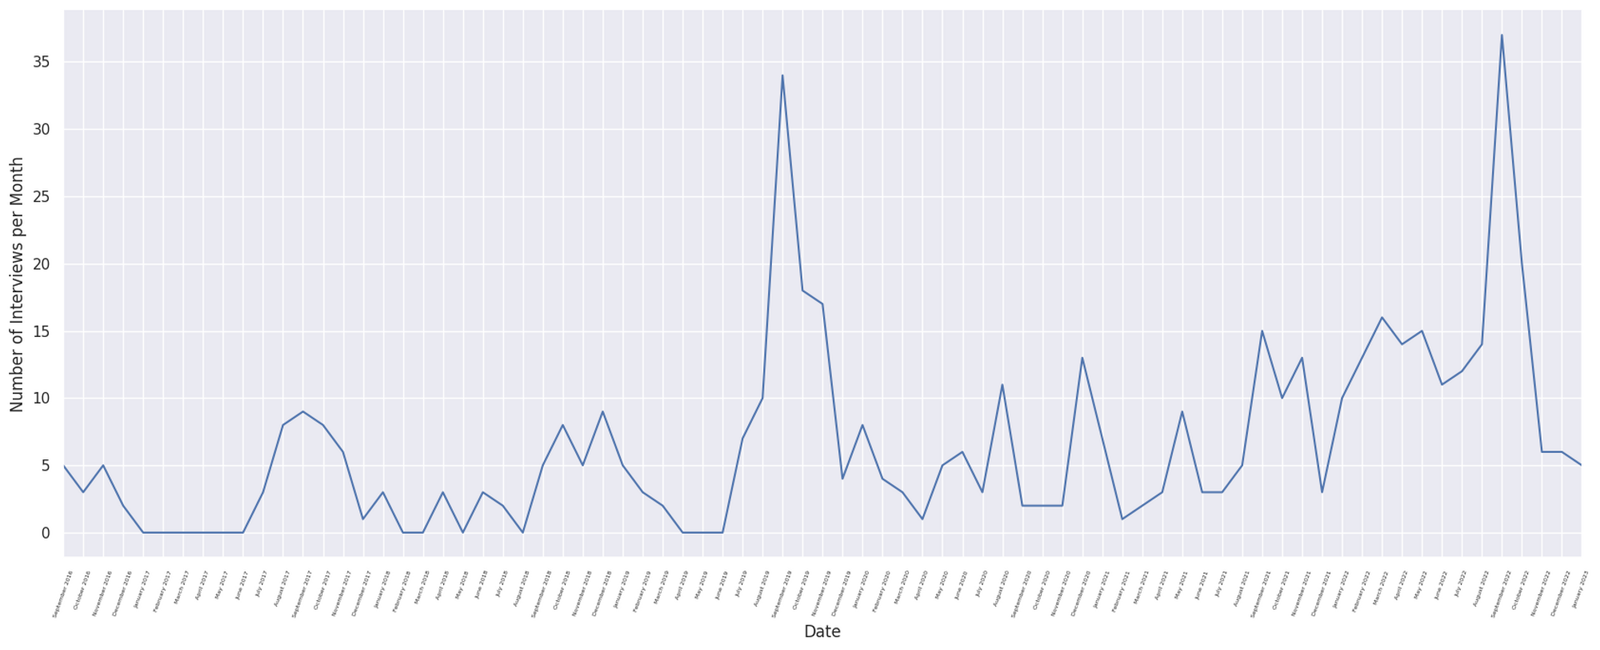
Interviews Over Time
With some tweaks to my SQL query from earlier and some more Python hacking, I can plot how many interviews I have been doing per month over time:
1:1s versus Group Meetings
I also calculated how many of my meetings are 1:1s compared to groups of 3 or more:
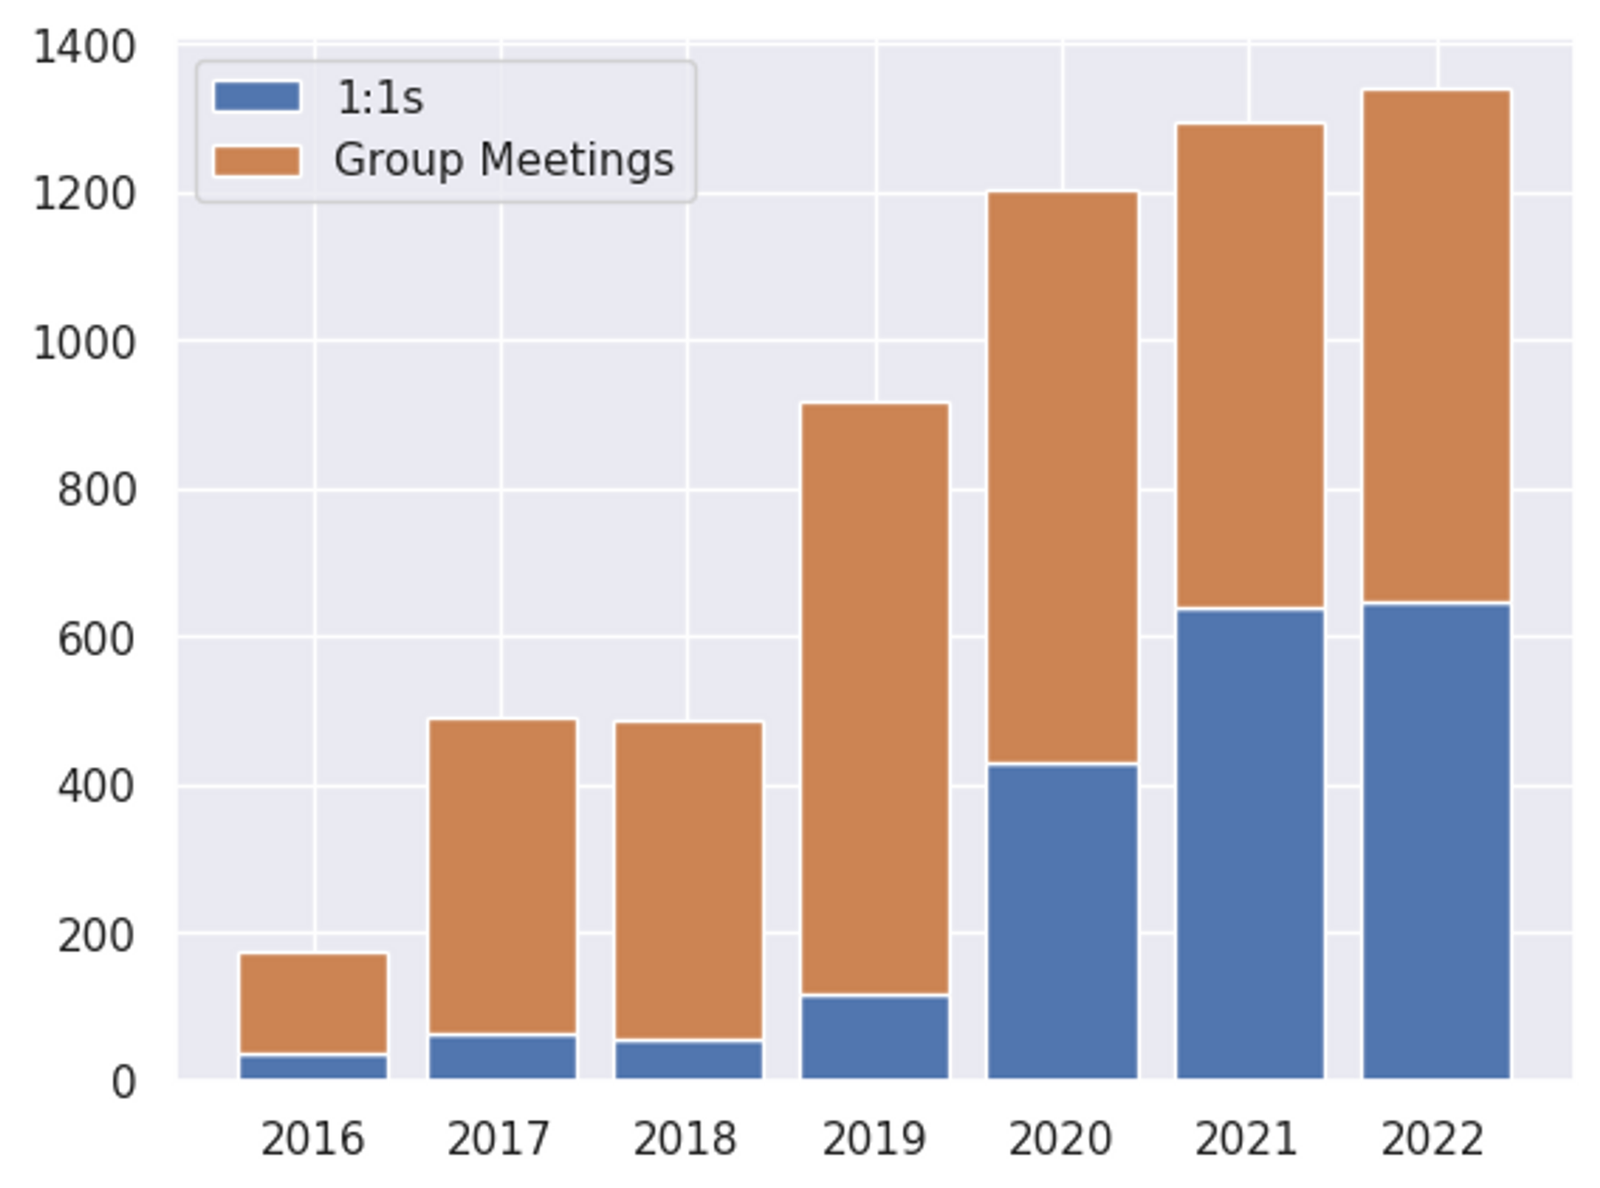
It’s very interesting to see that this has mostly stabilized in the last few years. Also, it’s relevant that the ratio between 1:1s and group meetings seems to be around 50/50 as an Engineering Manager. Without being able to compare this with other people, it’s hard to say for sure, but I think this is a healthy split for me.
Reflecting and Becoming More Conscious
My overall goal here is to eventually become more conscious about how much time I’m spending in meetings. Meetings are an important tool, but it’s way too easy to start spending too much time in meetings. The reason for this is that once your schedule becomes crowded with meetings, adding “one more meeting” isn’t that bad. However, many months and even a few years of this will almost necessarily lead to a schedule that doesn’t allow sufficient time for deep work.
Playing around with this data has given me a lot to think about for myself. I’ve already begun making some changes to my schedule, but more are yet to come. Hopefully, I will be able to help others too with the technical process for analyzing the data.
As always, feel free to reach out on Twitter if you have any thoughts to share with me on this.