Analyzing Visual Database Query Plans from a CLI

tl;dr: we’ve created new SQL commands ( SHOW PROFILE UI, EXPLAIN UI and SHOW PLAN UI) that allow developers to more easily visualize their SingleStoreDB query plans. It’s the little things!
I recently tried to define Database Developer Experience, which is where I’ve been spending most of my time in the last few years. One of the pillars I identified is “Observability”, which is a pretty broad area. But within this pillar, one of the most important features of a database product are its Query Plans. These are immensely helpful for software engineers working on complex database queries, as they give a glimpse into the inner workings of a database system and allow us to identify the performance bottlenecks of our queries. After investigating a query plan, a developer might decide to add/remove indexes from certain columns, rewrite their query in a different way, provide more hints to the optimizer, etc. Typically, these plans are visualized like so:
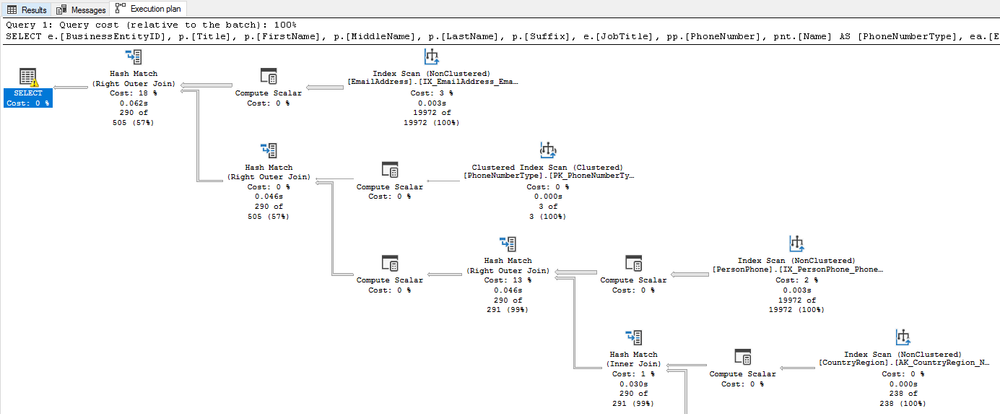
(Source: “Display an Actual Execution Plan” from Microsoft Learn for SQL Server)
At SingleStore, we’ve had a Visual Plan UI since 2018. It is a core part of our developer experience “toolkit”, as developers working with SingleStoreDB have to rely on it to get a deeper understanding of their queries’ performance.
For me, the biggest issue with the Visual Plan UI has always been how to access it. Until recently, developers had a few different options depending on whether they’re running SingleStoreDB Cloud or self-managing it.
- Run
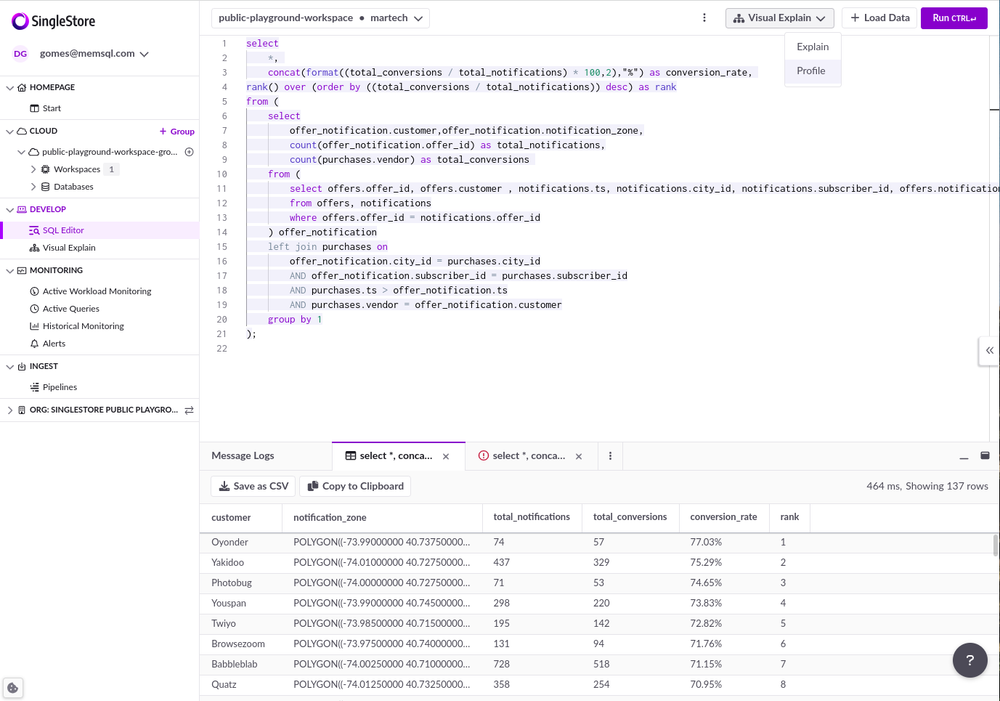
EXPLAIN JSONorSHOW PROFILE JSONfrom their terminals, and save that output into a file. Then, take that file and head into the SingleStore Cloud Portal/SingleStore Studio and load it there. - Write the SQL query in the SingleStore Cloud Portal’s SQL Editor (or SingleStore Studio for self-managed users), and click “Profile” in the UI.
Both of these options are fine. However, we’ve recently introduced a new command that will make it much easier for developers to visually inspect their query plans from wherever they are (e.g., their terminal or other SQL IDEs):
EXPLAIN UI <query>;

-- Actual example:
EXPLAIN UI select customer, sum(cost_cents) as revenue from notifications n
inner join offers o on o.offer_id = n.offer_id
group by ts, customer
order by revenue desc;
And for profiles:
PROFILE <query>;

SHOW PROFILE UI;
These commands return links that can be clicked for immediate browsing of the query plan:
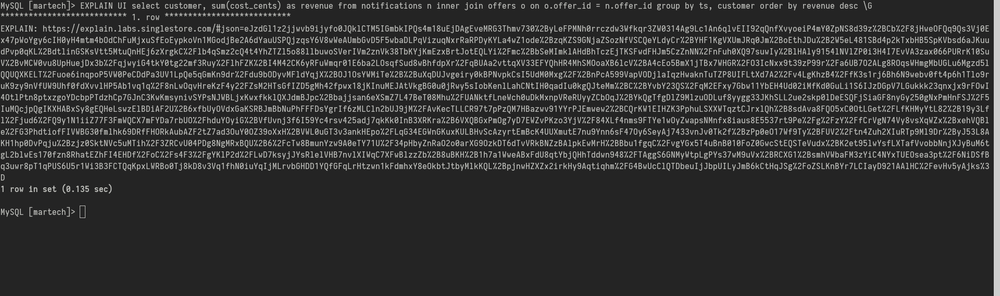
This URL takes you to explain.labs.singlestore.com, which is a new standalone Visual Plan analyzer we’ve built for SingleStoreDB, which doesn’t require authentication. This way, it works just as well for both SingleStoreDB Cloud and self-managed users.
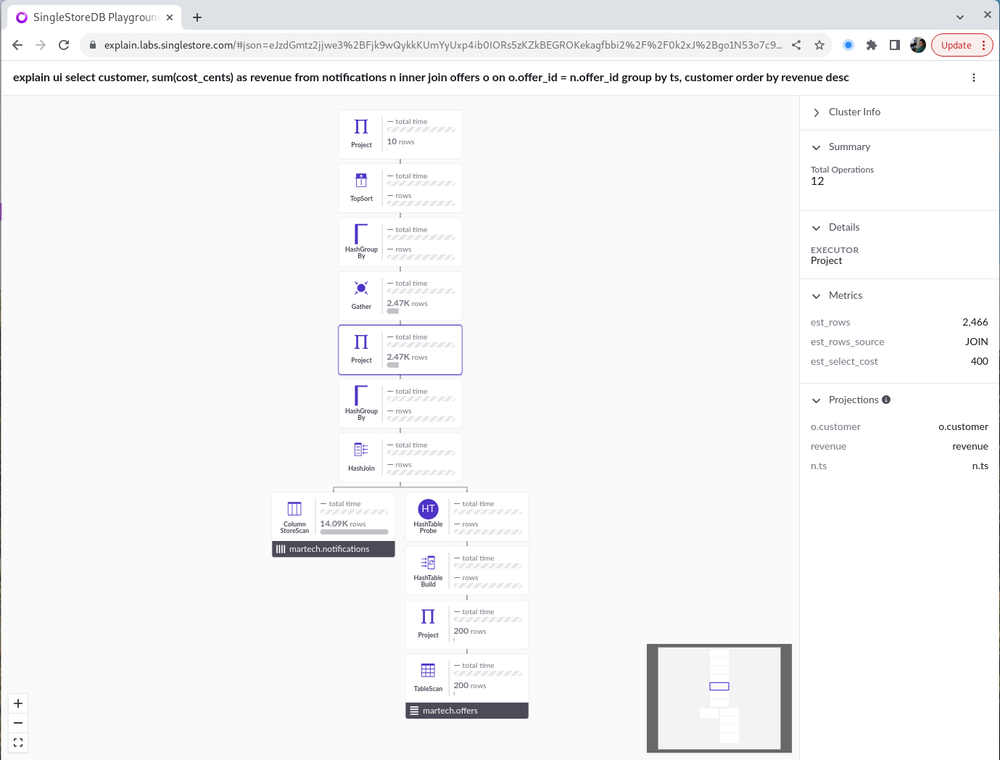
The code that powers this UI is the exact same code that we use for the SingleStoreDB Cloud Portal and the SingleStore Studio UI for self-managed users. We’ve packaged it up internally and we share the frontend for this entire feature across our various UI offerings.
Luis Neves and I were able to build this feature in just a couple of days earlier this year, and I hope that it can be used as an example of the importance of the “little things” when it comes to good Developer Experience. It’s a really small feature, but it will make it easier for developers to visually analyze their query plans. Furthermore, it should help a lot during interactions between support engineers at SingleStore and customers, where JSON files would often have to be sent back and forth to diagnose slower queries.
Feel free to reach out on Twitter!