A Simple System for Measuring Flaky Tests in a Large CI/CD Pipeline

We've all heard that one cannot improve what they can't measure. And this is obviously true about flaky tests in our CI/CD pipelines. At work (SingleStoreDB), we've been struggling with this for years but have recently found a mechanism that allows us to measure which individual tests and which test jobs are the flakiest. Despite our difficulties with flaky tests, it took us a long time to start tracking this data properly, which is somewhat embarrassing. Nevertheless, it's better to start late than to never start at all.
If you want a bit more context, I've written about our CI/CD pipeline at work before. We've got almost 200 CI jobs and our full pipeline runs take between 25 and 60 minutes depending on what we're changing (frontend, backend, scripts, deployment configurations, etc.).
How did we do it?
The first thing to understand is that there's lots of different test types and testing frameworks for different parts of the project. We've got Golang unit tests, integration tests, end-to-end tests with Cypress, Jest unit tests, database logic unit tests, Cypress component tests, etc. Some of our CI test jobs are running just one test or up to thousands of tests in a single job.
In order to make sense of all this, we need a standardized format for representing test runs. And that's where JUnit XML comes in:
The JUnit XML file format has been made popular by the JUnit project and has since become the de facto standard format to exchange test results between tools. JUnit-style XML files are generated by countless testing frameworks and are processed by CI tools, build servers and test management software to read and display test results.
The first step is then to have all test jobs output a JUnit XML file. This is easy for test jobs that are using test frameworks such as Cypress (cypress-junit-reporter) or Go Test (go-junit-report). If you have custom written test jobs, you'll have to generate JUnit XML files yourself, which isn't that hard. You also have to make sure that the test file is being saved as an artifact of the test job.
The second step for us was to track all this data for every single pipeline run in the main development branch. For this, we implemented an after_script command that takes this data and ships it to a centralized location. We're using GitLab CI/CD, but this should be applicable to any CI/CD system. And in our case, we're using a remote SingleStoreDB instance, but any database will do the job. We created a table with the following schema:
CREATE TABLE `test_results` (
    `test_name` text,
    `job_name` text NOT NULL,
    `job_id` bigint(20) NOT NULL,
    `pipeline_id` bigint(20) NOT NULL,
    `branch` text NOT NULL,
    `passed` tinyint(1) NOT NULL,
    `execution_time` float DEFAULT NULL,
    `commit_sha` text NOT NULL,
    `created` datetime NOT NULL DEFAULT CURRENT_TIMESTAMP,
    `result` enum('pass','fail','skip','error') DEFAULT NULL
);
This is a relatively simple schema that allows us to track individual test results and execution time for each job for every pipeline in any branch.
Then, in our GitLab CI/CD config, we have a very simple:
...
after_script:
   - python3 process_job.py
...
This script uses the junitparser Python library to parse the JUnit XML file and eventually run an INSERT INTO the table that I described above.
How can we do with this data?
We've been able to build various useful tables and charts! And we even set up automated reporting to post some of these to our team's Slack channel once per week.
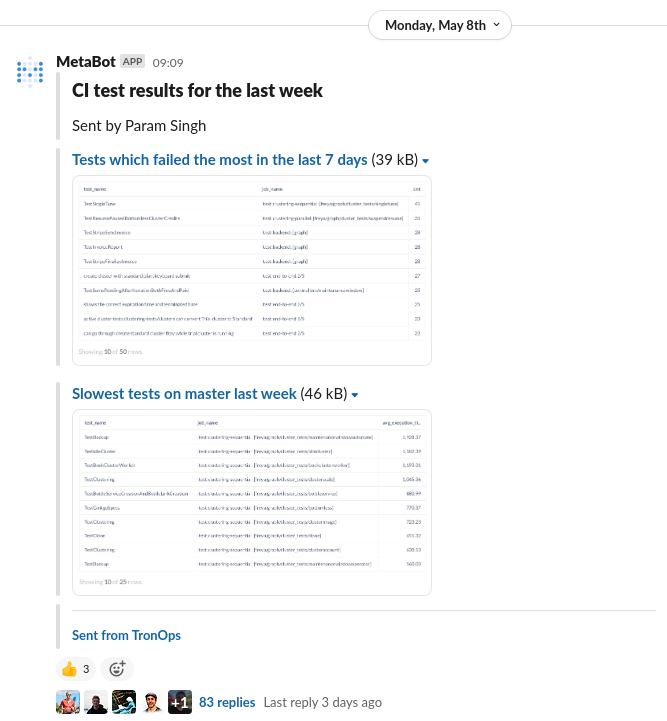
For the first report, "Tests which failed the most in the last 7 days" here's the SQL query we run:
SELECT test_name, job_name, count(*) as cnt
FROM helios_test_results
WHERE created >= DATE_SUB(CURRENT_DATE(), INTERVAL 7 DAY)
  AND (result = 'fail' OR result = 'error')
GROUP BY test_name, job_name
ORDER BY cnt desc
LIMIT 50;
It's really simple!
What's missing?
The main thing that's missing is actually fixing all these tests so they're not flaky! We're obviously working on that now that we have much better visibility than before over the data.
Another aspect that's missing is that the test execution time data does not include queuing time (sometimes our jobs have to wait before they can start). Fixing this would require refactoring our system to leverage the GitLab API to get the full test execution time as opposed to the time in the JUnit XML file.
Finally, we can try to do a few more interesting things with this data:
- Measuring overall flakiness over time (more specifically, it'd be nice to know if flakiness is going up or down week after week)
- Filing tasks automatically to test owners if tests are detected to be flaky
- Automatically running newly introduced or recently modified tests thousands of times during the weekends in order to gather more data about potential flakiness
- etc.
Reach out on Twitter if you have thoughts on any of this!
And of course, Param Singh and Ricardo Marques did 99% of the hard work described in this blog post, so all the credit goes out to them!